Wand statistic() function in Python
Statistic effect is similar to Spread effect, the only difference is that, it replaces each pixel with the result of a mathematical operation performed against neighboring pixel values.The width & height defines the size, or aperture, of the neighboring pixels.
The type of statistic operations can be any of the following:
- ‘gradient’
- ‘maximum’
- ‘mean’
- ‘median’
- ‘minimum’
- ‘mode’
- ‘nonpeak’
- ‘root_mean_square’
- ‘standard_deviation’
Syntax : wand.image.statistic(stat, width, height, channel)
Parameters:
Parameter Input Type Description stat basestring The type of statistic to calculate. See STATISTIC_TYPES. width numbers.Integral The size of neighboring pixels on the X-axis. height numbers.Integral The size of neighboring pixels on the Y-axis. channel basestring Optional color channel to target.
Input Image:
![]()
Example 1:
# Import Image from wand.image module from wand.image import Image # Read image using Image function with Image(filename ="koala.jpeg") as img: img.statistic("median", width = 8, height = 5) img.save(filename ="kl-statistic.jpeg") |
Output:
![]()
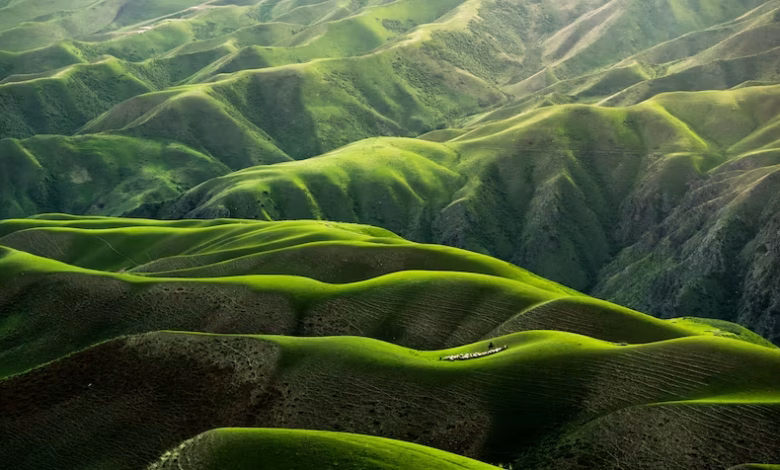
Input Image:
![]()
Example 2:
# Import Image from wand.image module from wand.image import Image # Read image using Image function with Image(filename ="road.jpeg") as img: img.statistic("median", width = 8, height = 5) img.save(filename ="rd-statistic.jpg") |
Output:
![]()