

Now the Kia Boys can navigate away from the crime scene with Google Maps

Summary
- Hyundai and Kia are teaming up with Google to roll out Android Automotive in future models, with Google Maps already integrated into their current systems.
- Hyundai’s partnership with Google will give drivers access to over 250 million points of interest, making navigation smarter with real-time updates on business hours, ratings, and more.
- Starting in 2026, Hyundai will launch a new infotainment system powered by Android Automotive, a full, car-specific OS, unlike Android Auto.
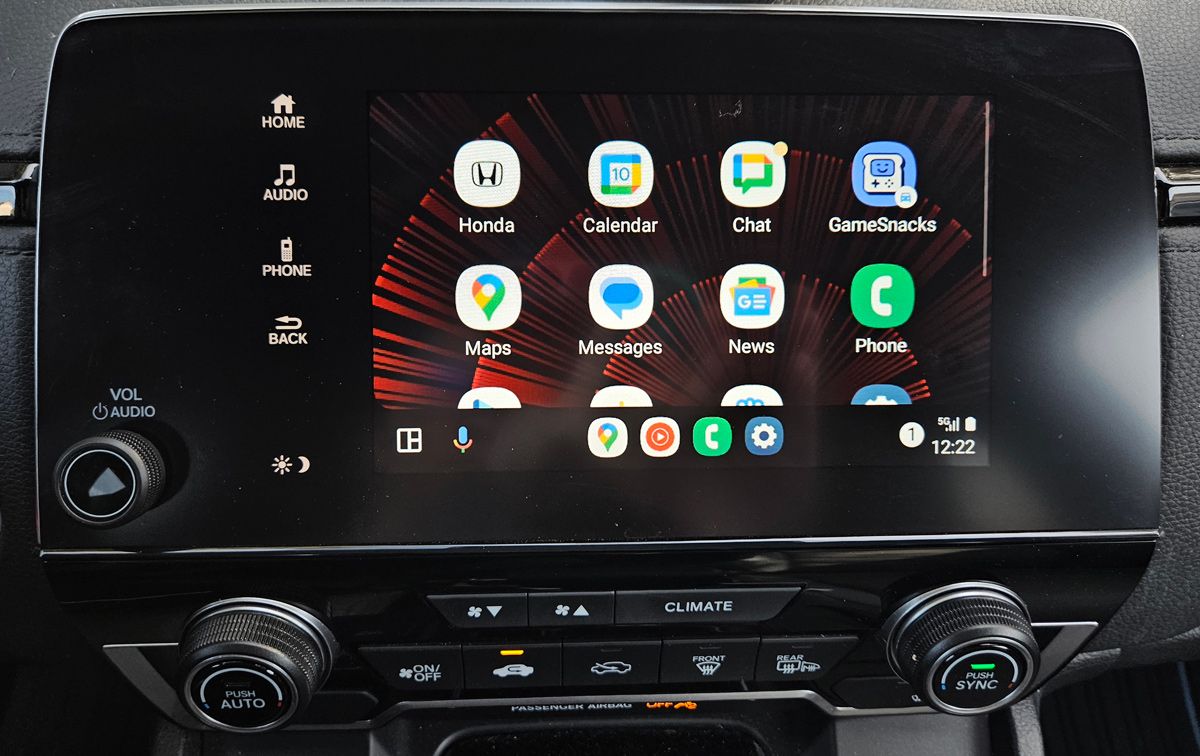
Cars these days are basically “smartphones on wheels,” and for good reason. Step inside, and you’ll find massive touchscreens running user-friendly software that lets you control the car, stay connected online, and sync with your phone. South Korean giants Hyundai and Kia are leaning into this tech-forward trend by teaming up with Google in order to roll out Android Automotive in their future models. Ahead of that integration, Google Maps is already making its way into their current infotainment systems.
Android Auto vs. Android Automotive vs. Google Automotive Services (GAS)
Google’s car-friendly services can be confusing. Let’s break them down
Hyundai announced that it’s teaming up with Google Maps to load its upcoming cars with access to over 250 million points of interest—from your go-to grocery store to those hidden gems you didn’t know existed. Kia is kicking things off in North America, with the rollout set to hit Hyundai, Kia, and Genesis models around the globe soon after (via 9to5Google).
The South Korean automaker sees these upgrades as a key part of its ongoing partnership with Google, aimed at speeding up the development of its “software-defined vehicles” (SDVs). By integrating Google Maps Platform’s Places API, Hyundai plans to make navigation smarter, with real-time updates on everything from business hours to ratings, reviews, and more, as per Hyundai’s announcement.
Hyundai and Kia vehicles are shifting to Android Automotive next year
While the Google Maps upgrade is a big leap forward, Hyundai is set to take things even further. Starting in 2026, the company will roll out a brand-new infotainment system powered by Android Automotive. Unlike Android Auto, which mirrors your phone’s display, Android Automotive is a full-on, car-specific operating system.
Hyundai is joining a growing list of automakers jumping on this platform, with the Genesis GV90, an all-electric model, being the first to feature it. The second-gen Hyundai Ioniq 5 is also expected to debut with this OS. Android Automotive also runs Maps directly and can support apps from the Google Play Store, giving you a seamless, all-in-one setup.


